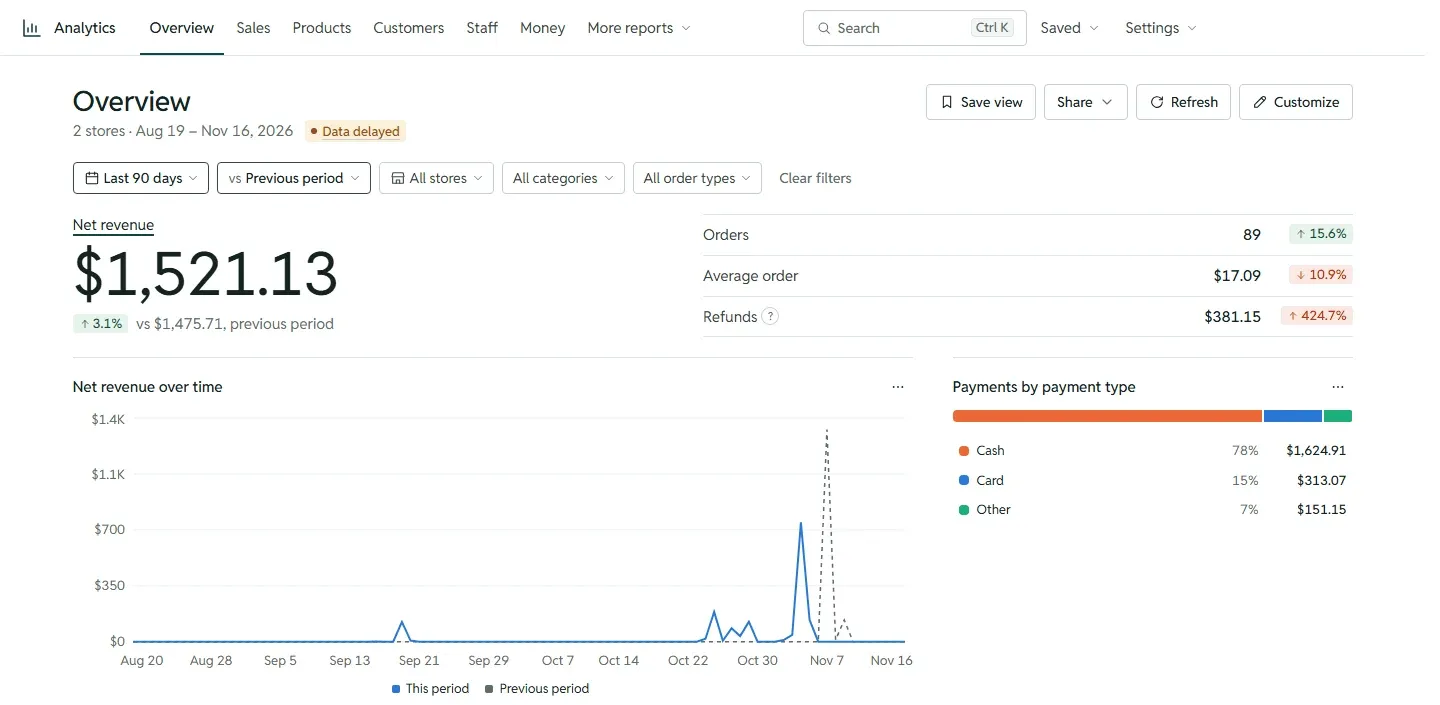
What it does
- Report pages for Overview, Sales, Products, Customers, Staff and Money.
- More than 50 built-in reports.
- Filter by period, comparison period, store, category and order type. Click a chart to filter.
- See the orders behind any figure, and open an order with its payments and refunds.
- Download any page as CSV or Excel.
- Several stores together, with store groups.
- Invite your team, with roles and access to chosen stores.
- Checks that the figures match Clover’s own.
How it works
- Open Analytics from Clover. It brings in your sales history.
- Pick a report page and a period.
- Filter by store, category or order type, and click into any figure.
- Save the view, download it, or share a link.
The report pages
Overview gives the day at a glance: net revenue, the trend, payment types, top products and busy hours. Sales breaks it down by hour, weekday, order type and discount. Products shows what sells, what sells together, and which items make up most of your revenue. Customers covers new and returning customers and how each month’s newcomers keep coming back. Staff shows sales and tips per employee, with commission plans if you pay them. Money covers tenders, cash, refunds and voids.
Every figure opens the orders behind it, and every order opens its payments and refunds.
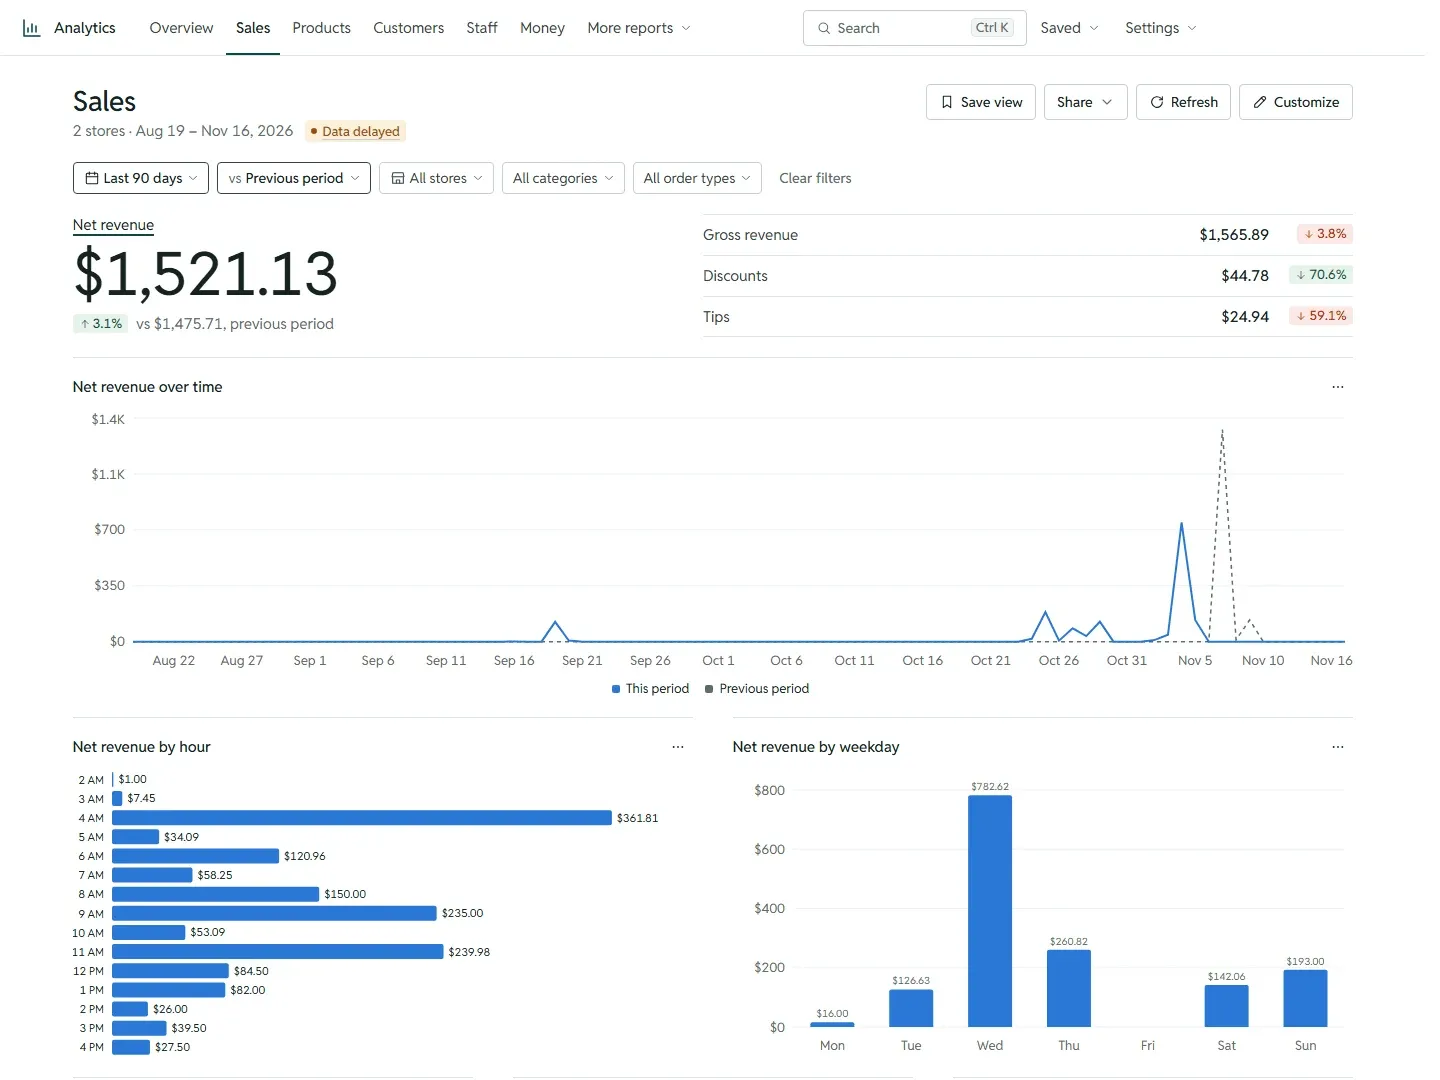
Beyond the main pages
Forecast projects the coming weeks from your own sales. Bought together lists items that sell on the same order, which helps with combos and shelf placement. ABC classes sort products into the few that make most of your revenue and the long tail that doesn’t. Cohorts follow each month’s new customers to see how many come back. Commissions applies your commission plans to each employee’s sales. Cash and Voids show what moved through the drawer and what was taken off orders, and by whom.
Also included
You can customize pages, add your own measures, save views and search everything. The Overview page opens with a morning brief.
Who it’s for
Restaurants, cafes, shops and owners of more than one store.
Good to know
Analytics only reads from Clover; it never changes your data. Scheduled report emails come in a later version.
Questions
How do I print reports on Clover?
In Analytics, open any report page and use Print or save as PDF. You can also download a page as an Excel workbook, or a single chart or report as CSV. Clover's own reports print from its Reporting app on the device or the Reports page in the web dashboard.
How much sales history does it bring in?
All of it. Recent sales show up in seconds and older history fills in behind them. After that, figures refresh about every 15 minutes.
Can I see several stores together?
Yes. Pick several stores or a store group and the reports add them up. Each store's own figures stay separate underneath.
Can my managers see reports without seeing everything?
Yes. Invite people as Owner, Manager or Viewer, and give each one only the stores they need. Viewers can't export.
How do I know the numbers are right?
The Data checks page compares each receipt's total with Clover and marks it Matches Clover or Total differs, with a CSV you can download.
Can Analytics change my Clover data?
No. It only reads from Clover.